Salal built a tool that will graph a web page, displaying the different tags like images, tables, and links. The resulting graph provides a visual clue to the organization of the home page (or any page.) This is Mac5:
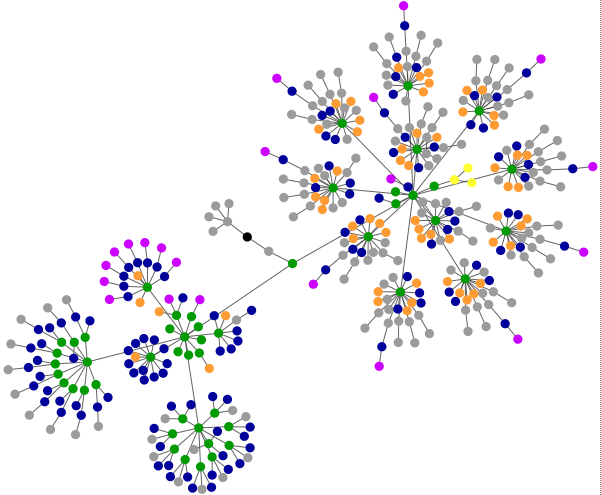
Color indicates the most used tags in the following way:
blue: for links (the A tag)
red: for tables (TABLE, TR and TD tags)
green: for the DIV tag
violet: for images (the IMG tag)
yellow: for forms (FORM, INPUT, TEXTAREA, SELECT and OPTION tags)
orange: for linebreaks and blockquotes (BR, P, and BLOCKQUOTE tags)
black: the HTML tag, the root node
gray: all other tags