
One of the things that comes up around tax time is capital gains. Short term gains for investments held less than one year are taxed as regular income (25% for me) while any gains on investments held for more than one year are taxed at only 15%. I’m usually investing for the long term with mutual funds, whereas I will be happy to sell a stock after it goes up 20% regardless of how long I have held it. Every now and then when I get close to 1 year, I might hold on to get a long term gain instead of short term.
With mutual funds, I might move money around every now and then, but not really that much. I’ve had investments in the same mutual fund sometimes for 10 years or more, so anytime I sell anything in that fund, it will be a long term gain. Even if I buy some shares and then sell them the next month, the IRS sees that as long term because I can sell the older shares instead of the ones I just bought. The only time I get messed up with that is with wash sales where I sell at a loss within a month of buying shares. I got some wash sales during the financial crisis with Suntrust stock as its stock price went on a roller coaster ride and I was hitting 20% gains or losses within a few days.
I also get wash sales every now and then with Vanguard’s Short Term Corporate Bond Fund. I use this fund almost like a bank account because it gets better interest than any bank account or CD, and the price of the shares doesn’t change that much because it isn’t as sensitive to interest rate swings (not that we’ve had a lot of swings) since most of its bonds are 90 days or so. The bond fund generates a dividend every month. As I get extra money in my checking account, I will buy some share of the bond fund. As I need money to buy stocks, mutual funds, or make big home purchases, I will redeem shares in the bond fund. And as I sell stocks or funds, the money goes back into the bond fund. The share price has stayed in a range between $10.60 and $10.90 for the last 4 years, while generating an annual effective dividend of 1.6% to 3.6% (lately usually around 1.8%).
When I get my 1099 from Vanguard, it will list every time I sell shares as a taxable event. And while the gain is usually very small due to the fact that the price doesn’t change by more than a few cents, sometimes it is long term and sometimes short term. And sometimes both, so it splits the sale into short term and long term parts. I have had money in this fund since 2009, so it seems like I should be long term, but I guess I have enough turnover that I have used up all the old shares. In 2011, I made a big withdrawal to knock off a chunk of my home mortgage, and then in 2012, I did that again to pay off the mortgage. In 2013, I used money to pay for some home improvements like the furnace, air conditioner, and gutters. Plus every year I usually pay for my Roth IRA contribution with this fund, so I end up with a lot of withdrawals.
It kind of bothers me that until the 1099 statement shows up, I have no idea whether the gains or losses will be short or long term. I have a spreadsheet for each of my investments that does a pretty good job of keeping up with the number of shares and the average cost of those shares, so I know what the gain or loss will be. Recently I sold $1,000 worth of shares and had a loss of $1.42 (average cost was $10.765 per share and I sold at $10.75 per share). What is bad about that is that I had gotten a monthly dividend just a week before that, so part of the sale will be a wash sale because I bought shares within a month of selling them at a loss. The wash sale rule is there so you don’t sell shares and then buy them right back just to harvest a loss you can use on your taxes without really changing your investments (if everyone did that it might make market crashes even worse as everyone sells their shares to harvest losses). But the question is was the $1.42 in losses going to be short term or long term? I already know that 6 cents of the $1.42 is a wash, but I have no idea when I bought the shares that I am now selling.
When I buy and sell shares, they are in clumps, but when I receive dividends, those are pretty small and I get them every month. So I think it would be easier to identify when bought shares are sold rather than when sold shares were bought. I could sell $1,000 worth of shares which might cover several months of dividends. Eventually I would find out that when I sold a large block of shares to help pay off my mortgage, the shares sold had been bought with 13 different transactions, most of which were dividend reinvestments. Since I sell only in good size blocks it might be easier to track each purchase by the dates that those shares eventually would be sold. I would find out that the most sales it ever took to get rid of a block of shares I had bought were 5, and that was unusual because it never took 4, but there were a number of times it took 3 sales to cover one block (this is largely because you have split blocks on each side of one solid block). Most dividend reinvestment purchases are easily covered by one sale.
I was thinking about how a spreadsheet could keep up with all of this, but was not getting very far. So I decided to just do it the hard way and do everything by hand at first. As I worked through it, I was hoping to see a pattern where I could use some formulas to help me out, preferably formulas that could be cut and pasted, rather than a custom formula that points to specific cells. Since April 2009 when I first bought shares, I have had 159 transactions on this account.
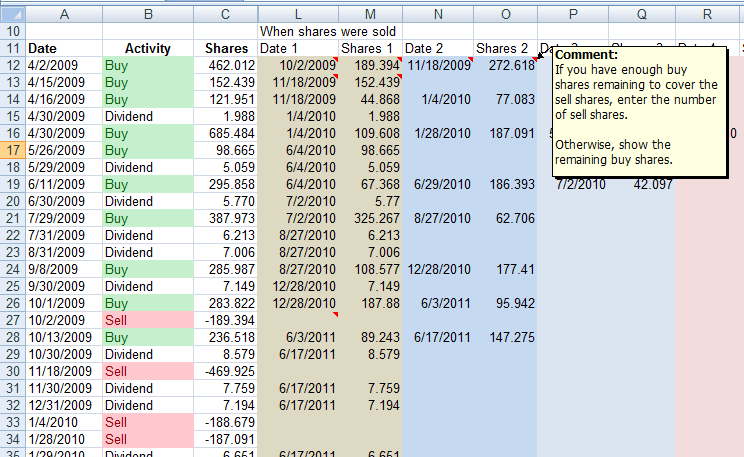
Here is the spreadsheet. I have hidden all of the columns that have to do with dollar amounts because all I am interested in is matching up when shares are sold. I did some conditional formatting so that a line with “Buy” on it would show up in green and a “Sell” order would show up in red. This made it easier to pick out Sell orders.
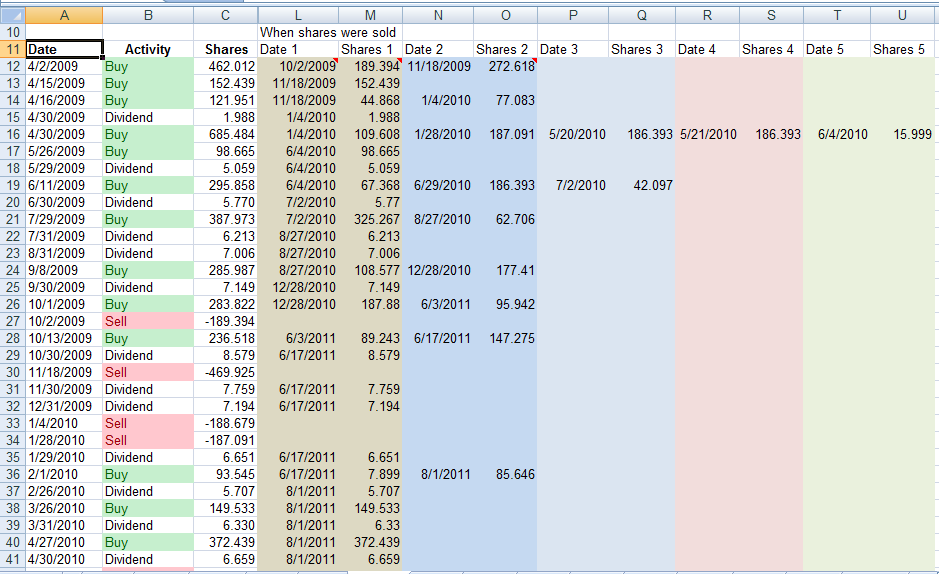
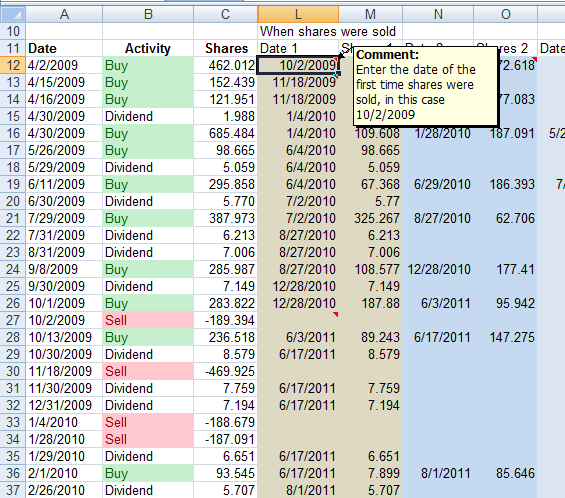
Doing it by hand wasn’t that bad conceptually, but it meant scrolling around and looking for a lot of information in the spreadsheet. Originally I bought 462.012 shares on 4/2/2009. Then I looked down to the first time I ever sold shares: 10/2/2009. So at the end of the line for 4/2/2009, I entered 10/2/2009 in a column.
On 10/2/2009 I had sold 189.394 shares, so next to 10/2/2009 instead of entering the actual number of shares as 189.394, I could just make an equation where the value equaled the value of shares sold in that sell date (e.g. “=C27” instead of typing in “189.394”), but that isn’t a generic equation since it points to a specific cell.
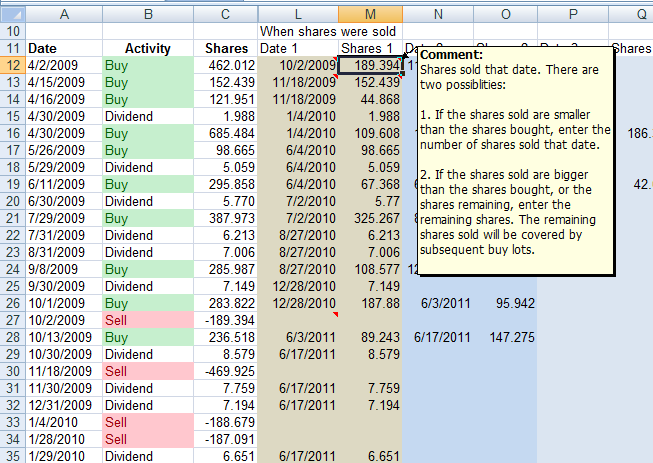
The 10/2/2009 shares that were sold are less than the shares I bought on this line, so I needed to look further down the column for the next Sell order, which was on 11/18/2009. In a third column I entered 11/18/2009.
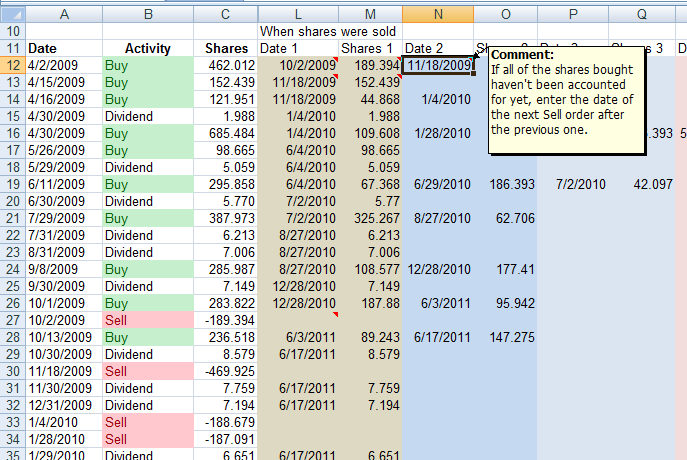
The 469.925 shares sold on that date were more than the shares remaining from this Buy block, so I entered the rest of the buy shares, using a formula of all of the original buy shares minus the amount I already had marked as sold, two columns before. This still leaves some of the shares sold 11/18/2009 as uncovered, but I can handle those later on.
Now I had to go to the next time I bought shares, which was the next line, 4/15/2009, when I had bought 152.439 shares. Since I still needed to deal with the rest of the shares sold on 11/18/2009, I entered the date as 11/18/2009.
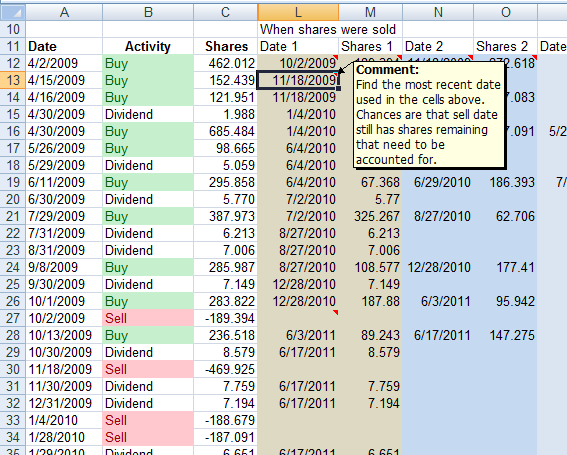
Even after subtracting out the shares from the previous row that covered part of the 11/18/2009 shares, there were still enough to completely cover all of the shares bought in this row, so I entered all of the shares bought on 4/15/2009.

Now I went to the next Buy line, which was the next line, 4/16/2009, when I had bought 121.951 shares (the next day! The first month isn’t over and I have bought 3 batches of shares). I knew I would be selling shares bought 11/18/2009 since those still weren’t all gone yet, so I entered that date again. Then I had to total up all the shares I had already marked on 11/18/2009 on the previous lines. There were two blocks marked 11/18/2009 on the lines above this, so I could just take the total shares sold on 11/18/2009 and then subtract the two blocks on the previous lines. This could also be done using a SUMIF equation on each pair of columns where I marked the date and number of shares sold, then subtract that from 11/18/2009 sell shares. But if the net was still bigger than this number of shares, I should just enter the number of shares in this buy block. So I could write an IF statement comparing the shares sold on that date compared to the shares above that I have already covered that date. I could even use a LOOKUP function to get the shares sold using the date I had entered. In fact, at least in the first column, I could get that date by taking the highest date used in all of the blocks above that line. 11/18/2009 was the highest date in those blocks, meaning I am still working on covering the 11/18/2009 (with regular stocks where the buy and sell blocks might be matched exactly, that wouldn’t always work). So I was able to get some automation going. Basically 1 of 2 things can happen: either the number of shares sold is bigger than the shares bought or the number of shares sold is smaller than those bought. If the number of shares sold is smaller, then I would go to the next pair of columns and find the next Sell order. But if the shares sold are greater then I go to the next line where I bought shares.
It was easy for me as a person to look up the next Sell order, but not so easy to come up with a spreadsheet function that would do this. The problem was it had to look up the next value of Sell after the date of the last Sell that had been dealt with. I couldn’t figure out how to do this with standard LOOKUP features. I have even done some stuff with combining MATCH and INDEX functions, but couldn’t think of a way to do that. I briefly investigated Excel’s array functions which can do some interesting things on groups of data, but that was pretty confusing too and I still couldn’t see how I could have it look up the next Sell row after the last Sell row I had used. There are some ways to look up the address of a cell, but I wasn’t sure I could incorporate that into a range like A12:C100.

In the end, I decided maybe I could try some kind of Visual Basic for Applications (VBA) function. I called the function NextSale. It would take the date of the most current sale (easy, just the most recent date of all previously entered sell batches) and return the date of the next sale. Interestingly, there is a VBA Find function that will find a value in a range after some point within that range. All I had to do was find the cell where that date occurred and then start looking for “Sell” after that cell. So if I had been working on the 11/18/2009 shares, I would have it find what row 11/18/2009 was on, then look beyond that for the next occurrence of Sell. It took a while to get all of that to work properly, but I had something that worked great and was now able to be completely automated, except maybe the first row or so.
However, I ran into a problem. On 7/31/2013 I had sold some shares. But because it was the last day of the month, I had also bought some shares that day when my monthly dividend was reinvested. That’s rare, but that is what happened. My VBA function found the correct Sell row and returned the corresponding date, but my LOOKUP to find out how many shares were sold on that date found the reinvested dividend, and that messed everything up because not only was it the wrong number, but it was also a positive number (shares bought) instead of the expected negative number (shares sold).
Another problem I had was that after I had accounted for the last sell order, the NextSale function just started back at the top of the range again. It seems like there should be a way to stop that from happening, but I never really got that far.
As I was writing this, I thought of another approach to find the next sale without using VBA. I set up a new column where I numbered all of the rows where I sold shares. Then I could use a VLOOKUP function to look up the previous sale date to get the corresponding sale number. I then could add one to the sale number, and do another lookup to get the date of the sale for that sale number.
The other thing that could be done is to take the date I bought the shares and compare that to the date a block of shares was sold. If this is less than 1 year, it would be a short term gain (or loss). I was able to use conditional formatting to make the date red if it was less than 1 year after the shares were bought.
Then I wanted to actually break the sale down into short and long term portions. To do this, I set up 5 columns that would identify the sales on each Buy line (it never took more than 5 Sell batches to cover a Buy batch) as ST or LT. Then I could use a SUMIF to find all the ST shares for that date and the LT shares for that date (or just subtract the ST shares from the total to get LT). This got me pretty close to what Vanguard reported, but I was off by 0.004 shares. I then noticed that my total number of shares was off by 0.004, so I went through old statements until I found that I had entered something wrong a couple of years ago. Now it is right on the money, though I’m still not messing with wash sales yet.
re: “It kind of bothers me that until the 1099 statement shows up, I have no idea whether the gains or losses will be short or long term. ”
After reading this post, I decided it doesn’t bother me to just wait and see if what I get smells right.
Right, and because of the wash sales, I still don’t have the cost basis right, just the number of shares. With wash sales I think you can apply the disallowed loss on your next sale, but I think maybe Vanguard just throws it into the average cost of the shares forever. I’d have to take a closer look, which I haven’t done.
I’m surprised you read this one. This is one of those posts that is more for me to go back and look at. And it totally worked because while I was writing and explaining, I was able to think up a way to look up the next sale date without using VBA.