
I was reading some information from a CBS Marketwatch columnist named Paul Merriman. He writes about mutual funds and generally likes Fidelity and Vanguard funds and so do I. His advice is usually good without getting too technical. Anyway he recommended to one writer that they try a simple market-timing technique if they’re tired of being beaten over the head with bad returns but don’t want to miss out on bull markets either. I’ve always thought timing was crazy and that it couldn’t be done. But it started to make sense . . .
He uses the average price of a fund for the last 100 days. If the current price of the fund is above that price you need to buy. If it goes below that price you sell. It sounds like you are buying high and selling low, but it works on trends that last longer than 100 days (like the 3 year crash) even though you are just about guaranteed of never selling at the peak or buying at the bottom.
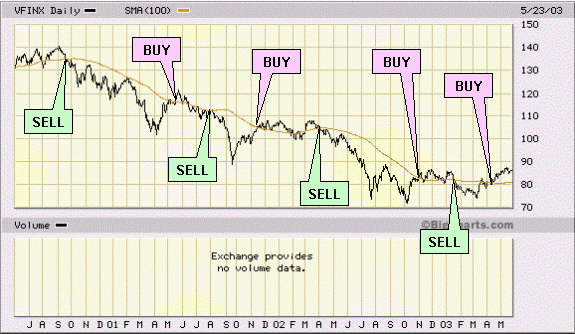
You can look at this graph of Vanguard 500 Index fund over the last 3 years to see how it works. The smooth line is the average, the jagged line is the day-to-day price. I’ve marked most of the buy and sell points (there are more but are hard to make out at that resolution). What the timing would have done is had you uninvested during most of the crash (but not all). He points out that your risk can only be reduced because you’re either in the market or in cash (drawing some interest). Any time you’re in cash is less risky than when you are invested. So there’s less risk.
That’s great, but does it work when the market is going up? Yes, as this graph for 1997-2000 shows.
Watch when you buy and when you sell. You want to buy at a lower price than you sell. You want to sell higher than your next buy. He ran his method on a bunch of different mutual funds and indexes over long periods of time and found that he loses money 70% of the time when he buys and then sells using this. But in the 30% that he makes money, he makes a lot bigger hits.
Of course you would get hit for capital gains when you buy and sell and many mutual funds charge extra for getting out of a fund in less than a year. While you may not buy and sell more than a few times a year, it could put a hurt on you.
So I’m trying this with a fairly volatile Fidelity fund (it works better when there are ups and downs than steady growth) that makes up 20% of my retirement portfolio (Fidelity Over the Counter, FOCPX). In that account there are no transaction charges or capital gains taxes to worry about. So I’ll see how it works. Right now I’m in a buy position, so I don’t have to do anything. But I’ll have to check just about every day to find out if that’s a day to sell or not. We’ll see how it works and I will post follow-ups.
To get 100-day averages you can go to Big Charts and learn how to make charts that show an investment and it’s 100-day moving average. Then you can save that chart type using a javascript cookie and go back to it over and over. But you can also change the fund, index, length of time, etc. Merriman says there’s nothing magic about 100 days, except that it seems to work. Big Chart lets you pick up to three different moving average periods. The alternative is to keep a spreadsheet and enter values every day. You can get historical prices for any ticker symbol from Yahoo, copy and paste it into a text file and then import it into a spreadsheet. If you had years of historical data you could play around with the system more. Or you can look at the pretty graph.
He takes it further by saying you can compound (leverage) the gains by borrowing money to buy shares every time. If you invest $1000 you borrow $1000. Then you pay back the money when you sell and keep the additional. No thanks.
Read a follow-up to this entry posted the following March.
Had to respond with an article. See R.O.E.
I went through my first cycle of timing recently. As the stock market was going up I didn’t have to do anything since I was already invested. But as it plateaued the price finally crossed below the 50-day average (I decided the 100-day average was too conservative) signalling a Sell. The problem is you have to wait for the market to close to find out if you are below the line. Then you can’t sell till the following day so it could fall some more (plus I’d like to avoid buying and selling every day when the two lines are close). And there might be another day in there where you just forget to check. So I wound up well below the 50-day avearge when I sold (still above the 100-day).
Then the market started going up and the same thing happened in reverse where I ended up buying back in well above the 50-day line. It’s probably not a big deal because Merriman says you lose money on most round trips anyway but it really saves you on big trends. So I haven’t lost hope even though I bought back my shares for several hundred dollars more than I sold them for.